Zabbix is an open-source monitoring tool for network services, hardware, servers, and applications. Designed to track and monitor the status of your system and servers. Zabbix supports many database systems – including MySQL, PostgreSQL, SQLite, and IBM DB2 – to store data. Zabbix backend is written in C, and the frontend is written in PHP.
Grafana is an open source data visualization and monitoring suite. It supports Graphite, Elasticsearch, Prometheus, Zabbix, and other data sources. The tool provides a beautiful dashboard and metric analytics, allowing you to manage and create your dashboard for your apps or infrastructure performance monitoring.
In this tutorial, we will show you how to integrate Zabbix monitoring tool with the Grafana Dashboard. We will learn about the Grafana plugins installation, adding the data source to grafana, and import grafana dashboard to get a beautiful dashboard metric for our applications.
Himanshu Arora has written this article.
Prerequisites
- zabbix-box on IP 10.0.15.10 with zabbix installed – installation tutorial.
- grafana-box on IP 10.0.15.11 with grafana Installed – installation tutorial.
- root privileges
What we will do?
- Testing Zabbix and Grafana servers
- Install Grafana Zabbix Plugin
- Enable Zabbix Plugin
- Add Data Source to Grafana
- Enable Grafana Dashboard for Zabbix
- Sample Dashboard
Step 1 – Testing Zabbix and Grafana Installation
In this tutorial, we’ve two CentOS 7 servers with Zabbix and Grafana installed on it.
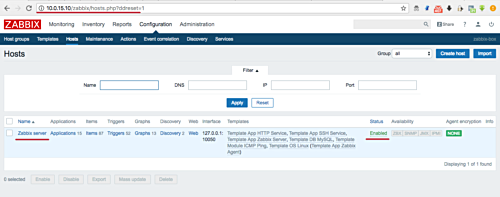
– Zabbix Server
Open your web browser and type the Zabbix URL as below.
Login to the Zabbix server and you will get the Zabbix Dashboard.
Below is my Zabbix server with default host Zabbix has been enabled for monitoring.
– Grafana Server
Open your web browser and type default grafana URL on port 3000.
Login to grafana dashboard and you will get the default page as below.
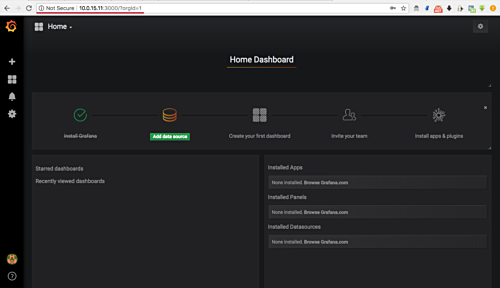
Zabbix and Grafana servers are up and running, ready for our integration tutorial.
Step 2 – Install Grafana Zabbix Plugin
In this step, we will install the grafana plugin using the grafana-cli command. We will install the grafana zabbix plugins data source on the grafana server, so we can add the zabbix data source to the grafana.
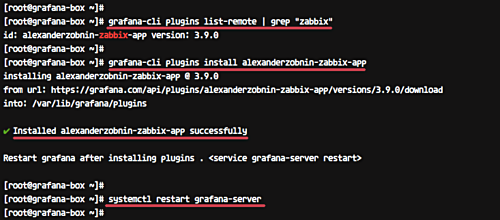
Run the command below to show grafana plugins list, and filter the ‘zabbix’ pattern using grep.
grafana-cli plugins list-remote
grafana-cli plugins list-remote | grep "zabbix"
And you will get the grafana plugin named ‘alexanderzobnin-zabbix-app’.
Install the plugin using the command below.
grafana-cli plugins install alexanderzobnin-zabbix-app
When the installation is complete, restart the grafana-server service.
systemctl restart grafana-server
Grafana plugin for zabbix data source support has been installed.
Step 3 – Enable Zabbix Plugin
Open your web browser and type the grafana server URL port 3000.
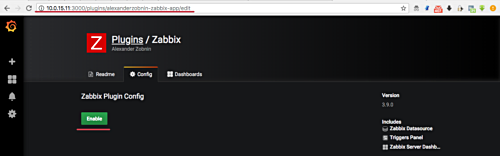
Log in and you will get the grafana home dashboard. On the right side, you will see the Zabbix apps installed, click the ‘Enable now’ link.
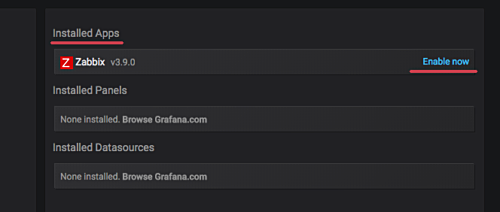
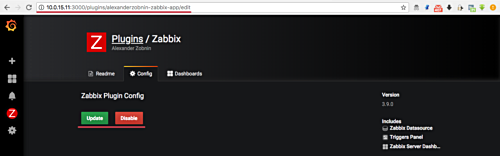
Click the ‘Enable’ green button.
Grafana plugins for Zabbix have been enabled.
Step 4 – Add Data Source to Grafana
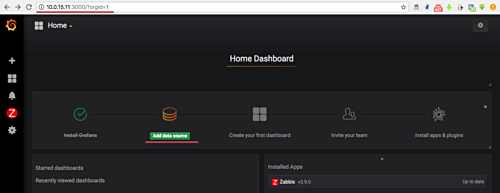
Goto the Grafana Home Dashboard and click the ‘Add data source’ button.
Now we need to setup the data source.
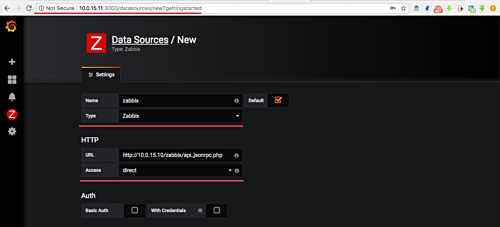
Add the data source named ‘zabbix’ and type ‘zabbix’.
On the HTTP section, type the zabbix API URL ‘http://10.0.15.10/zabbix/api_jsonrpc.php’ with ‘direct’ Access.
Scroll the page and you will see the other section.
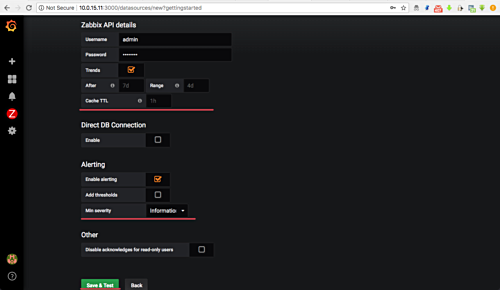
On the Zabbix API details, type your zabbix user admin and password. Enable the ‘Alerting’ with minimal severity ‘Information’.
And click the ‘Save & test’ button.
Now make sure you see the zabbix API version as below.
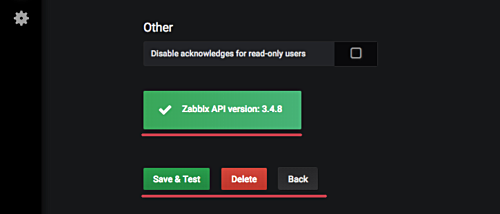
Zabbix data source has been added to the Grafana.
Step 5 – Default Grafana Dashboard for Zabbix
Zabbix plugin has come with the default Zabbix server dashboard.
Move your cursor to the dashboard menu on the left and click ‘Manage’.
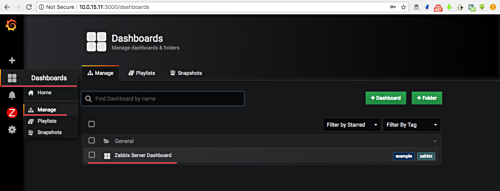
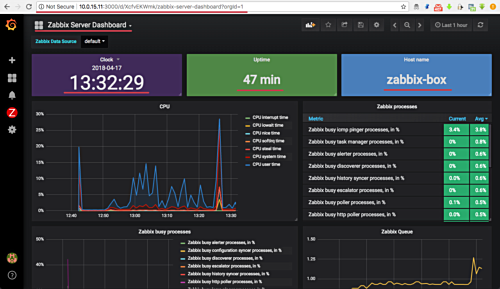
Now click the ‘Zabbix Server Dashboard’, and you will get the result as below.
Note:
As you can see in the screenshot, I just added the ‘Clock’ panel to the default Zabbix Server Dashboard.
The default Zabbix server dashboard has been enabled.
Step 6 – Sample Dashboard
Below is my sample dashboard, imported from this URL https://grafana.com/grafana/dashboards/4921.
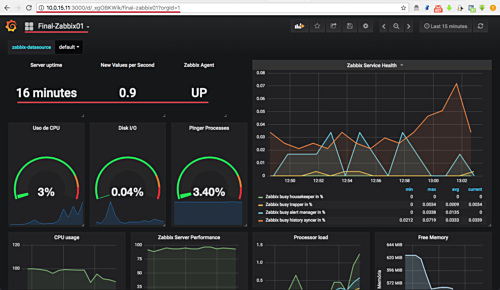
Integration of Zabbix monitoring tools with grafana has been completed successfully.